Customer service metrics are the numbers that show how well your support serves customers: how satisfied they are (CSAT, NPS, customer effort score), how quickly they get an answer (first response and resolution time) and how many problems are solved for good (resolution rate, first contact resolution). The few you run the team on are your KPIs.
This guide defines each metric with its formula in one table, then picks the ones an online store should track and separates team from individual indicators. It also explains why resolution rate and deflection rate are not the same thing, which matters once an AI agent takes tickets. External figures come from public sources, checked in October 2026.
What are customer service metrics?
Customer service metrics are numbers you record about your support: satisfaction, speed, resolution and workload. The difference between a metric and a KPI is the target: a metric is any number you track, while a KPI is one of the few you set a target on and manage the team by. Contacts at a store usually cluster around orders, returns and products, so check your own mix before setting targets.
Companies are measuring more than they used to. Salesforce’s State of Service report (6th edition, 5,550 service professionals) finds they now track more metrics than in 2022, and that the fastest-growing KPIs are tied to business outcomes. The share tracking revenue generation rose from 51% in 2018 to 91%, and retention tracking rose by 29 percentage points.
More numbers do not mean better management. The same report says 30% of service decision makers call outdated or irrelevant metrics a major challenge, and a further 40% a moderate one. For the wider picture of running a support team, start with the hub.
Which customer service KPIs matter most?
Pick one KPI for each question you need answered. Are customers satisfied: CSAT or customer effort score. Are problems solved for good: resolution rate and first contact resolution. Are they solved fast enough: first response and resolution time. Can the team keep up: backlog. Everything else is a diagnostic you open when a KPI moves.
That gives four families, and each earns its place for one reason:
- Satisfaction: the customer’s own verdict, so it catches what the process metrics miss.
- Resolution: whether the problem is actually gone, which is what the customer came for.
- Speed: how long people wait, which matters most when the answer is simple.
- Workload: whether the team can keep up, which shows trouble before satisfaction does.
Customer effort score has a research basis. It was introduced in Harvard Business Review in 2010 by Dixon, Freeman and Toman, who found it a better predictor of loyalty than customer satisfaction measures or NPS. That is 2010 research and a reason to consider it, not a rule.
How is each customer service metric defined?
Most metrics are a count divided by a count over the same period. Write the definition down before you report: what starts and stops the clock, what counts as solved, which tickets are excluded, and whether AI-handled tickets are in the denominator. Two teams can report the same metric name and mean different things.
Each metric ties back to cost per ticket, which our ROI guide covers, so the table gives each one a single line. Benchmarks for speed metrics are not repeated here.
| Metric | What it tells you | Definition | Watch out for |
|---|---|---|---|
| CSAT | How satisfied customers are with the help they got | The average of completed 1 to 5 survey scores; only answered surveys count | Some help desks show the percentage of good ratings instead (Zendesk: good ratings divided by rated tickets), so check which your tool shows. Also report the share of surveyed tickets that were rated |
| First response time | How long customers wait for a first answer | Median time from the customer’s first message to the first reply | Report per channel |
| Resolution time | How long a problem takes to solve | Median time from the customer’s first message to the ticket being solved; if it reopens, measure to the last solve (Zendesk calls this full resolution time) | Includes time waiting on the customer |
| Resolution rate | The share of problems solved for good | Tickets solved and not reopened or re-contacted within X days on any channel, divided by all tickets received, times 100 | You choose and state X. See the AI resolution rate note below |
| NPS | Willingness to recommend | Percentage of promoters (9 to 10) minus percentage of detractors (0 to 6), per Bain; the range of -100 to +100 follows from the formula | A relationship measure, slow to move after one ticket |
| CES | How easy it was to get help | The average answer to an ease question | Scales vary by tool (1 to 5 or 1 to 7); keep one |
| First contact resolution | Problems solved in one go | Tickets solved with one reply and not reopened, divided by solved tickets, times 100 (Zendesk’s one-touch definition; SQM calls it FCR) | Rates vary with how you measure them |
| Reopen rate | Replies that did not solve it | Reopened tickets divided by solved tickets, times 100 | Rising reopens can mean speed over quality |
| Backlog | Whether the team keeps up | All unsolved tickets (new, open, pending, on hold), counted at a fixed time each day or week | The trend matters more than the level |
| Tickets per agent | Capacity | Tickets solved per agent per period, averaged over a month | Easy tickets inflate it |
| Contacts per 100 orders | Demand relative to sales | Support tickets divided by orders, times 100, per contact reason | Read per reason, not only in total |
One distinction needs care. An AI resolution rate is a narrower measure over AI-handled tickets only: AI interactions resolved without escalation, divided by AI-handled tickets, times 100. It shows how much of the work the agent takes on it finishes, not what share of all problems were solved.
The resolution rate in the table uses all tickets received, so AI and your team can be compared on one base. They are not competing formulas for the same thing.
For first contact resolution there is a labelled benchmark. SQM Group’s FCR benchmark (updated August 2026) puts the call-centre average at 71%, calls 70% to 79% good and 80% or more world class, and reports a retail average of 77%. That is phone research, and the rate varies with how you measure it.
Which metrics should an online store track?
Track the standard KPIs per contact reason, not only in total. For a store the reasons are usually some mix of where is my order, returns and refunds, product questions before purchase, order changes, and damaged items. Each has its own fix. Add contacts per 100 orders so volume is read against sales.
| Contact reason | Metric to watch | What a bad number usually means |
|---|---|---|
| Where is my order (WISMO) | Contacts per 100 orders | Tracking information or the delivery promise is unclear |
| Returns and refunds | Resolution time and reopen rate | The policy is unclear, or the refund needs a person |
| Product questions before purchase | First response time on chat, resolution rate | The answer is missing from the product page |
| Order changes such as address or size | First response time against your dispatch cut-off | The change window passes before anyone replies |
| Damaged or wrong items | First contact resolution, CSAT | The reply did not ask for the photo or order number up front |
During sales and holiday peaks, measure backlog daily. A rising backlog shows a capacity problem before CSAT does. Where the same questions keep returning, the fix is often self-service rather than more agents, and outsourced agents should be measured on the same KPIs as your own team (see outsourcing).
What is the difference between team and individual performance indicators?
Team indicators (CSAT, resolution rate, first contact resolution, backlog, response time) show whether customers are served. Individual indicators (tickets solved, handle time, per-agent CSAT, reopens) help coaching but are noisy and depend on which tickets someone gets. Manage the team on outcomes; use individual numbers to start a conversation, not to rank people.
| Metric | Team use | Individual use | Caution |
|---|---|---|---|
| CSAT | Trend by channel and contact reason | Each rating is tied to the agent who solved the ticket (Zendesk) | Small samples, and harder queues score lower |
| First contact resolution | Process health | Coaching on complete answers | SQM finds 49% of first-contact failures come from policies, processes and procedures, and 38% from agent errors |
| Tickets solved | Capacity planning | Average over a month (Zendesk) | Easy tickets inflate it |
| Resolution time | Customer wait | Rarely fair per agent | Includes time pending on the customer (Zendesk) |
| Reopen rate | Quality check | Spot rushed replies | May mean speed over quality (Zendesk) |
AI changes the baseline. Salesforce’s State of Service report (7th edition, November 2025) found that reps using AI spend 20% less time on routine cases. If an AI agent takes the routine tickets, the ones left for people tend to be harder, so expect handle time and tickets per agent to shift. Re-baseline rather than compare with last year. How work is split is covered in our AI agent comparison.
Resolution rate vs deflection rate: what does each really count?
Deflection counts contacts that did not reach a person. Resolution counts problems that were solved and did not come back. A customer who gives up on a chatbot and emails tomorrow is deflected but not resolved. To compare AI with your team, report resolution with a re-contact window, over all tickets received.
Deflection is popular because it is cheap to count. The Salesforce 6th edition notes an uptick in service organisations measuring case deflection in 2022, a sign of an efficiency focus. Resolution needs an extra check that the customer did not return.
Definitions also differ per tool. In Zendesk’s documentation for its earlier automated resolutions platform (prior to resolution tiers), an email AI resolution counts after 72 hours of inactivity when the AI gave a generative reply, the customer gave positive or no feedback, no human replied, and an LLM check confirmed the request was resolved. Read your own tool’s definition before you compare numbers.
Counting has a second trap: some help desks leave AI-only tickets out of their standard reports, as our ticket reporting guide explains, so add AI and human tickets together before you calculate a resolution rate.
| Term | Counts | Misses |
|---|---|---|
| Deflection rate | Contacts that never reached a person | Whether the problem was solved |
| Containment | Conversations the bot kept to itself | Customers who gave up |
| Automated resolution | Whatever the tool defines; check its silence rules | Re-contacts on another channel |
| AI resolution rate | AI-handled tickets resolved without a human, divided by AI-handled tickets | The tickets the AI never took on, so it is not a share of all problems |
| Resolution rate with re-contact window | Solved and not back within X days on any channel, divided by all tickets received | Little, but it needs ticket matching by customer |
A practical check: read a weekly sample of AI-closed and human-closed conversations against the same rubric. The AI resolution rate suits judging the agent on its own workload. The all-ticket resolution rate is the one for comparing AI and people.
Where do customer service metrics mislead?
Metrics mislead when a number is optimised on its own. Fast replies that solve nothing raise reopens. CSAT from a few surveys hides the silent majority. Averages are pulled by a few old tickets. Call-centre benchmarks do not fit an email-first store. Pair every speed metric with a quality metric.
Zendesk’s guidance says speed does not always equal quality, and that reopened tickets may signal speed over quality. The 2010 HBR research advises focusing on problem solving, not speed. Report the share of surveyed tickets that were rated next to CSAT, and for time metrics report the median per channel.
Set targets from your own baseline per channel and contact reason, not from SQM’s phone figures. Hand-offs also stretch resolution time, which our guide to escalation covers.
Where does Engaige fit?
Engaige (that’s us) isn’t a reporting tool: it is the e-commerce-native AI support agent that works inside the help desk your conversations already land in, and your existing reports stay where they are. Engaige AI learns from your conversations and inputs, configures your support agent, and shows which policies it used. At Otrium, 60% of 120,000 annual tickets are resolved end to end.
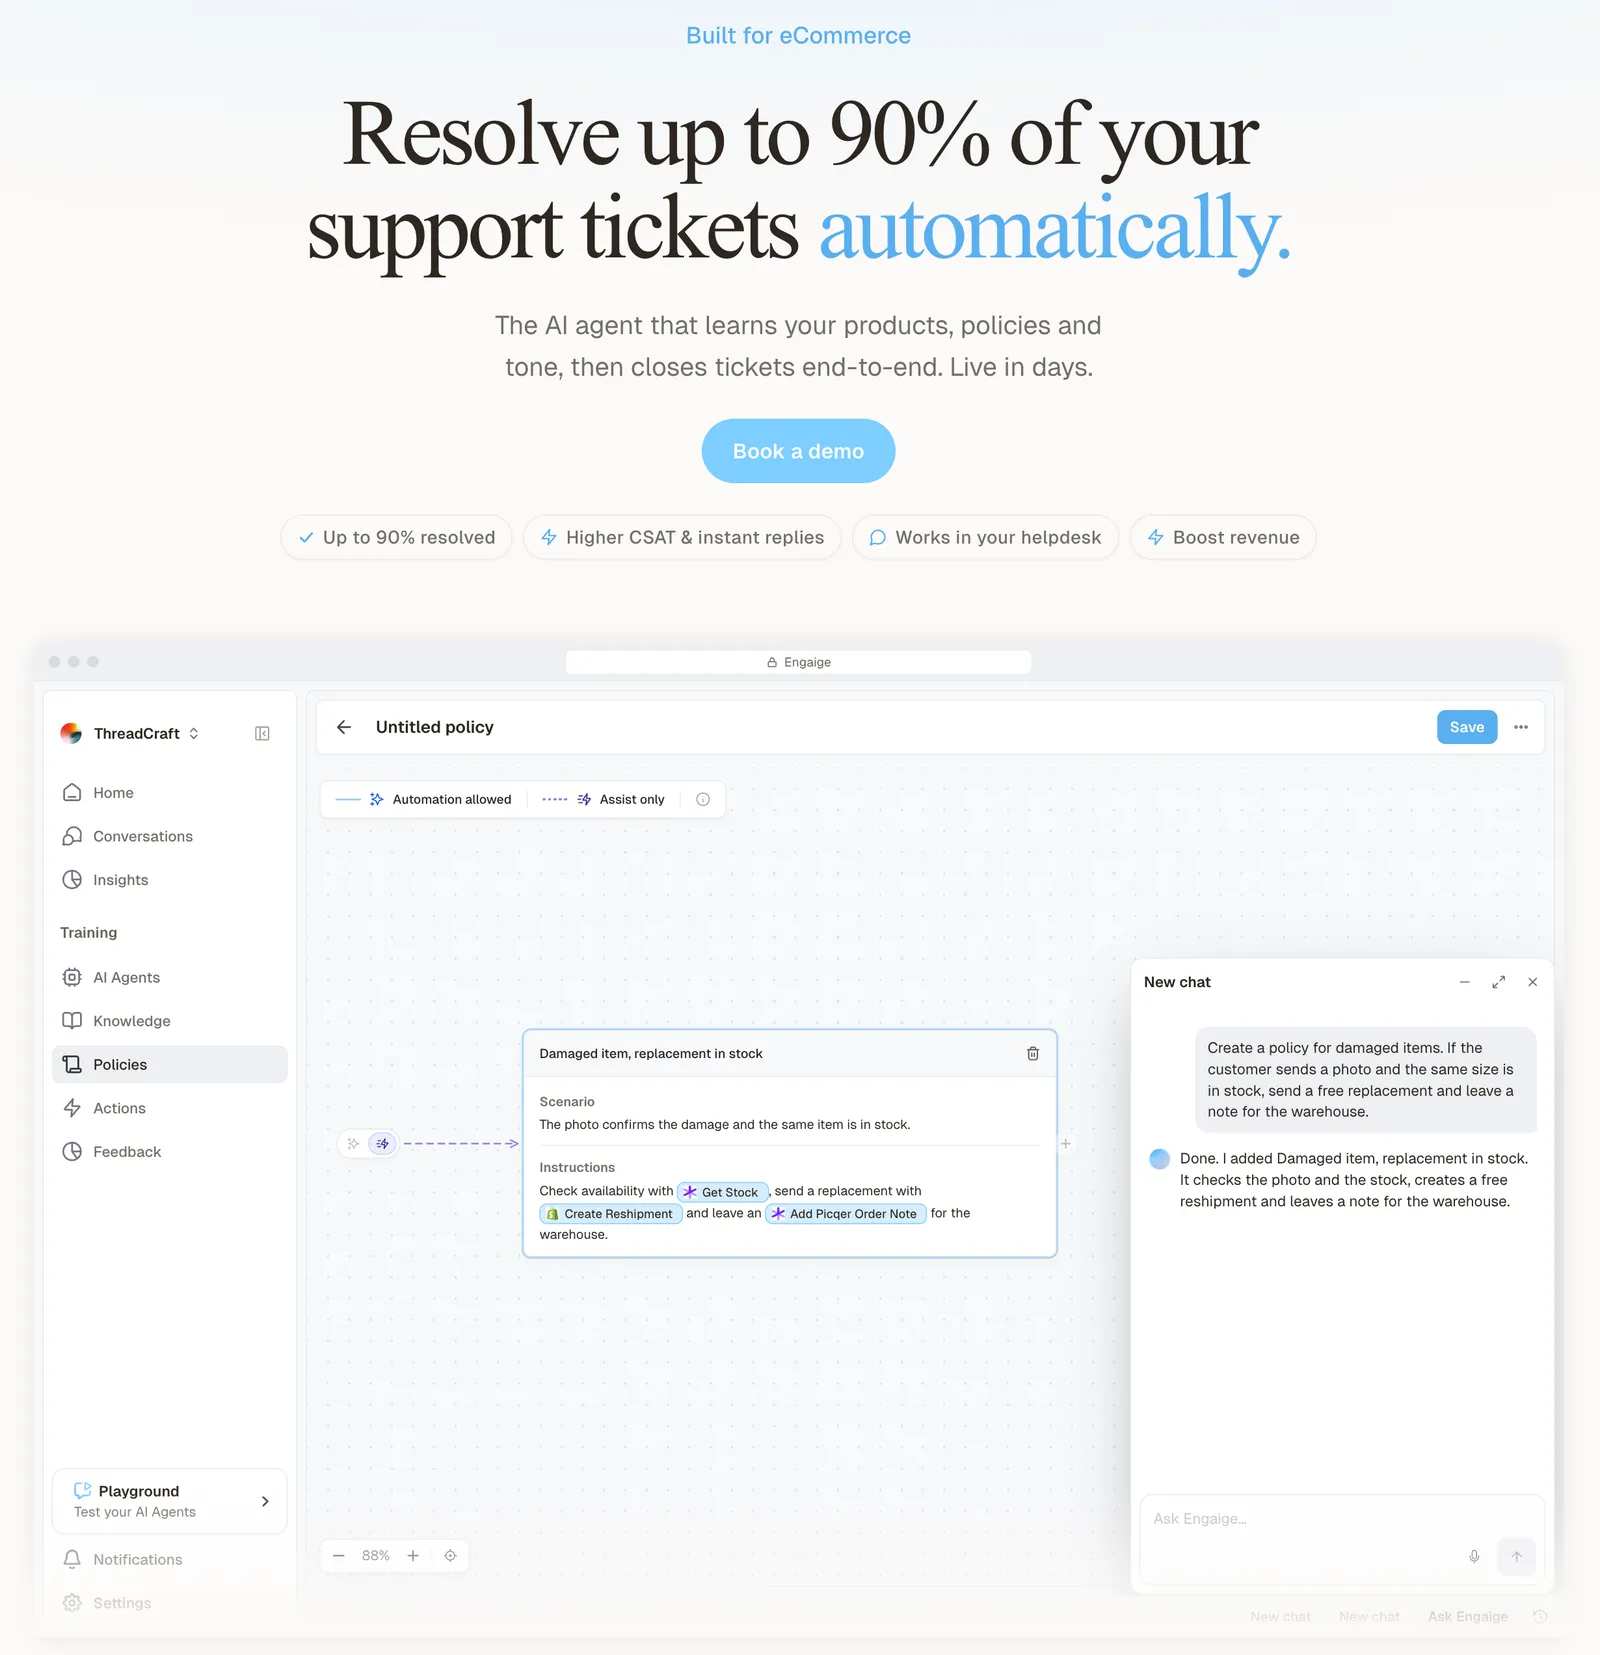
Count any AI agent the way you count your team: same denominator, with a re-contact window. A hand-back to a person is not a resolution, as the deflection section explains.
You go live in Agent Assist in hours, with Engaige drafting replies inside your help desk, and nothing closes without a human. Every reply your team sends becomes training data. Engaige shows where your team’s handling differs from what the agent proposed, and Engaige AI proposes what to change, which you approve.
You then flip ticket types to autonomous one at a time. Brands that move quickly reach autonomy in about a week, and Engaige automates up to 90% of supported tickets. Once autonomous it keeps learning from emerging trends and the tickets it hands back.
Otrium’s Head of Operations counts that result the way this guide recommends: over all the tickets the team receives.
With Engaige, we are able to automatically resolve 60% of the 120,000 support tickets that we receive annually.

You stay in control of what the agent may do alone, every answer shows its reasoning with the source, and the integration is deepest on Shopify. Engaige is e-commerce-specialised, not a generic horizontal tool. The full picture is in the support hub, and you can see it on your own tickets in a demo.
Frequently asked questions
What are customer service metrics?
Numbers that show how satisfied customers are, how fast they get answers and how many problems are solved for good. KPIs are the few you set targets on.
What are the most important KPIs for customer service?
One per question: CSAT or CES for satisfaction, resolution rate and first contact resolution for solved problems, first response and resolution time for speed, and backlog for workload.
How do you calculate CSAT and NPS?
CSAT is the average of completed 1 to 5 survey scores, though some help desks show the percentage of good ratings instead. NPS is the percentage of promoters (9 to 10) minus the percentage of detractors (0 to 6), per Bain.
What is a good first contact resolution rate?
SQM’s call-centre research gives 71% as the average, 70% to 79% as good and 80% or more as world class, with retail at 77%. Set your own baseline per channel.
What is the difference between resolution rate and deflection rate?
Deflection counts contacts that never reached a person. Resolution counts problems that were solved and did not come back.
Should you measure individual agents on customer service KPIs?
Manage on team outcomes and use individual numbers to coach: SQM finds policies, processes and procedures behind the largest share (49%) of first-contact failures, against 38% for agent errors.
How should you count tickets an AI agent resolves?
In the same denominator as your team, with a re-contact window. An AI resolution rate over AI-handled tickets only is a narrower measure of the agent’s own workload, and a hand-back to a person is not a resolution. See the deflection section.
Does Engaige replace my help desk reports?
No. Engaige works inside the help desk you already run, and your reports stay where they are. It does not run ticket reports or dashboards, so keep measuring in your help desk.