Ticket reporting is pulling your help desk’s ticket data into regular reports that show how many tickets arrive, through which channels, why customers contact you, how fast the backlog moves and who handles what. A good ticket report ends in a decision: a policy, page or process to fix, or a staffing change. Without that decision it is only a chart. This guide is about customer tickets at online stores, not IT, incident or event tickets.
This guide covers the six ticket reports an online store needs, how to build one, how to turn it into a fix, and how often to send it. It is part of our support hub. External facts come from public help desk documentation and research, checked in October 2026.
What is ticket reporting?
Ticket reporting turns the tickets in your help desk into grouped views you can act on. A ticket report is different from a metric. A metric is one number, such as first reply time or CSAT. A ticket report groups tickets by a dimension (week, channel, contact reason, agent) so you can see where the number comes from. This guide does not redefine the standard metrics; it shows how to cut them.
Every help desk ships prebuilt ticket reports. Intercom’s Tickets template ships with 14 ready-made charts. Zendesk’s Support dashboard has tabs for Tickets, Efficiency, Assignee Activity, Agent Updates, Unsolved Tickets, Backlog, Satisfaction and SLAs. The work is not building charts. It is choosing which few to read and what to do next.
For an online store the questions are familiar: where is my order, returns, address changes, damaged items, product questions. Ticket reporting tells you which of those is growing and why. Reports on IT incidents and changes are a different discipline, run by IT service desks.
Which ticket reports should you run?
Six ticket reports cover most of what a store’s support team needs: volume (created against solved), channel, contact reason, backlog, resolution (time and reopens) and agent workload. Each answers one question and points to one kind of action. Run these before you add anything else.
| Report | The question it answers | What to look at | The action it usually leads to |
|---|---|---|---|
| Volume | Are we keeping up? | Created minus solved per day or week; spikes after a campaign, a carrier delay or a stock-out | Staffing, or a fix upstream |
| Channel | Where do customers reach us? | Email, chat, WhatsApp and social, per week | Where to put people, and where first reply targets slip |
| Contact reason | Why do customers contact us? | Top reasons and their trend, such as WISMO (where is my order) | The policy, page or process fix (see below) |
| Backlog | How much open work is waiting? | Unsolved tickets by age and priority | Clear the oldest, or rebalance |
| Resolution | How well do we close? | Median time to resolve, reopens, one-touch share | Find where answers are incomplete |
| Agent workload | Who carries what? | Solved per agent averaged over a month, tickets handed off between teams | Coaching, routing or rota changes |
Help desks define the terms differently, so check the definitions behind each chart. In Zendesk, created tickets are a count of what arrived in the Support account. Solved tickets are those with a Solved or Closed status, and that report’s time filter uses the solved date. Backlog is every ticket still in a new, open, pending or on-hold state.
Zendesk advises comparing solved with open tickets, because it shows how well the team is keeping up with the queue. It also suggests looking at solved tickets for the team and for individual agents, averaged over a period such as a month.
Your help desk may already report the contact reason. Gorgias ships three e-commerce ticket fields: Contact Reason, Resolution and Product. Its Ticket Fields report shows the top 10 values and their progression over time. Intercom’s tickets lifecycle report has a count of tickets passed between teams or teammates. These are examples of what your help desk can already report.
How do you build a ticket report step by step?
Start from the decision the report must support, fix your contact reasons before you count them, pick one date basis and period, separate human and AI-handled tickets, then schedule the report to the people who act on it. A report nobody acts on is a dashboard, not a ticketing report.
- Write the question. For example: which contact reasons grew this month, and why?
- Fix a short list of contact reasons. Use a dropdown field, not free tags. Zendesk suggests you add a custom field to your tickets and support request form to categorise requests. Gorgias pre-fills Contact Reason and Resolution with suggested values and can fill Contact Reason with AI.
- Choose the date basis. Use the created date for incoming volume and the solved date for output, and keep it the same week to week.
- Choose the period and the statistic. Report weekly for operations. Use the median for durations: one long unassigned conversation can skew an average, which is why Intercom advises the median over the mean.
- Put AI-handled and human-handled tickets in one view. See the section on where reports mislead.
- Add a comparison. Use last period, the same week last year, or before and after a change.
- Write one line of interpretation and one proposed action under each chart.
- Schedule delivery. See the cadence section below.
Keep the contact-reason list short and shaped around a store: order status, delivery problem, return or exchange, refund, damaged or wrong item, product question, address or order change, payment and other. Review “other” monthly, and move anything recurring into its own reason.
How do you turn a ticket report into action?
Read the contact-reason report as a list of things to fix outside the inbox. Each top reason has an owner: a delivery question belongs to fulfilment or carrier communication, a sizing question to the product page, a refund question to the returns policy. Fix the cause, then watch the reason shrink in the next report.
More first-contact failures trace to policy and process than to agents, as our metrics guide shows.
| Contact reason | Likely cause to check | Owner | Fix to try | Watch next report |
|---|---|---|---|---|
| Where is my order | No or late shipping notification, stale tracking | Fulfilment, ops | Proactive tracking updates, a tracking page | Order-status share |
| Damaged or wrong item | Packing or pick errors | Warehouse | A packing check, a replacement policy | Damaged-item share by SKU |
| Return or exchange | Sizing, unclear policy | Merchandising, CX lead | A size guide, clearer returns wording | Return-reason mix |
| Refund status | Refund timing not communicated | Finance, CX | A status message once a return is received | Refund-status contacts |
| Address change | No self-service before dispatch | Ops | A change window and a clear cut-off | Address-change contacts |
Separate spikes from persistent reasons. Gorgias names the purpose of its ticket-field report as identifying areas for potential improvement, and its Trends view shows the top 10 values over time. In our reading, a trend chart lets you tell a seasonal spike, such as Black Friday week, from a reason that never goes away, and the two need different fixes. For peak, see our guide to scaling support over the holiday season.
Also look at which escalation triggers fire most and why; our escalation guide covers the process. Tickets an AI agent hands back to a person are a contact-reason report of their own, covered below.
How often should you report, and to whom?
Report daily on backlog for whoever runs the queue, weekly on volume, channel and contact reasons for the support lead, and monthly on trends, resolution and cost for the founder, operations or finance. Each audience gets the few reports it can act on, not the full dashboard.
| Cadence | Audience | Reports | Decision it supports |
|---|---|---|---|
| Daily | Queue owner, team lead | Backlog, unsolved by age, SLA breaches | Who picks up what today |
| Weekly | Support lead | Created against solved, channel, top contact reasons, reopens | Rota, macros, what to raise with ops |
| Monthly | Founder, ops, finance | Contact-reason trend, contacts per order, resolution, cost | Which upstream fixes to fund, hiring |
| Quarterly or after peak | Leadership | Before and after of fixes, peak review | Next season’s plan |
Contacts per order (tickets divided by orders) is our own framing, and it shows whether support load grows faster than sales. Cost reporting for finance is covered in our AI ROI guide.
Help desks schedule delivery for you. Freshdesk report schedules run daily, weekly or monthly, and scheduled exports are PDF only. Zendesk Explore dashboard deliveries can be scheduled up to 12 months ahead, and Zendesk advises scheduling for 2 AM so the previous day’s data has fully synced.
Keep the set short, and drop any report nobody has acted on for a quarter.
Where do ticket reports mislead?
Ticket reports mislead when the categories drift, when averages hide long tails, when AI-handled tickets sit outside the report, and when a falling ticket count is read as success without checking whether customers got an answer. Check the definitions behind each chart before you act on it.
- AI-handled tickets can be missing. Zendesk documents that tickets for conversations handled entirely by an AI agent do not appear in Explore reports (except the Resolution type field) or in ticket-listing API outputs by default. A drop in created tickets after launching AI may be a reporting effect, so put AI and human tickets in one denominator.
- Relabelling changes history. In Gorgias’s drill-down, values such as the assignee or contact reason reflect the ticket’s current state, not its state during the reporting period. Renaming a reason changes past counts, so freeze your list and change it on purpose.
- Averages hide long tails. Use the median for durations.
- Tools define things differently. In Intercom, reopen rate has to be worked out from reopened conversations rather than read off a ready-made chart. Compare like with like when you switch help desk.
- Fewer tickets is not the goal on its own. Resolution matters more than deflection, because a shopper who gave up on self-service and emailed anyway was not served.
Where does Engaige fit?
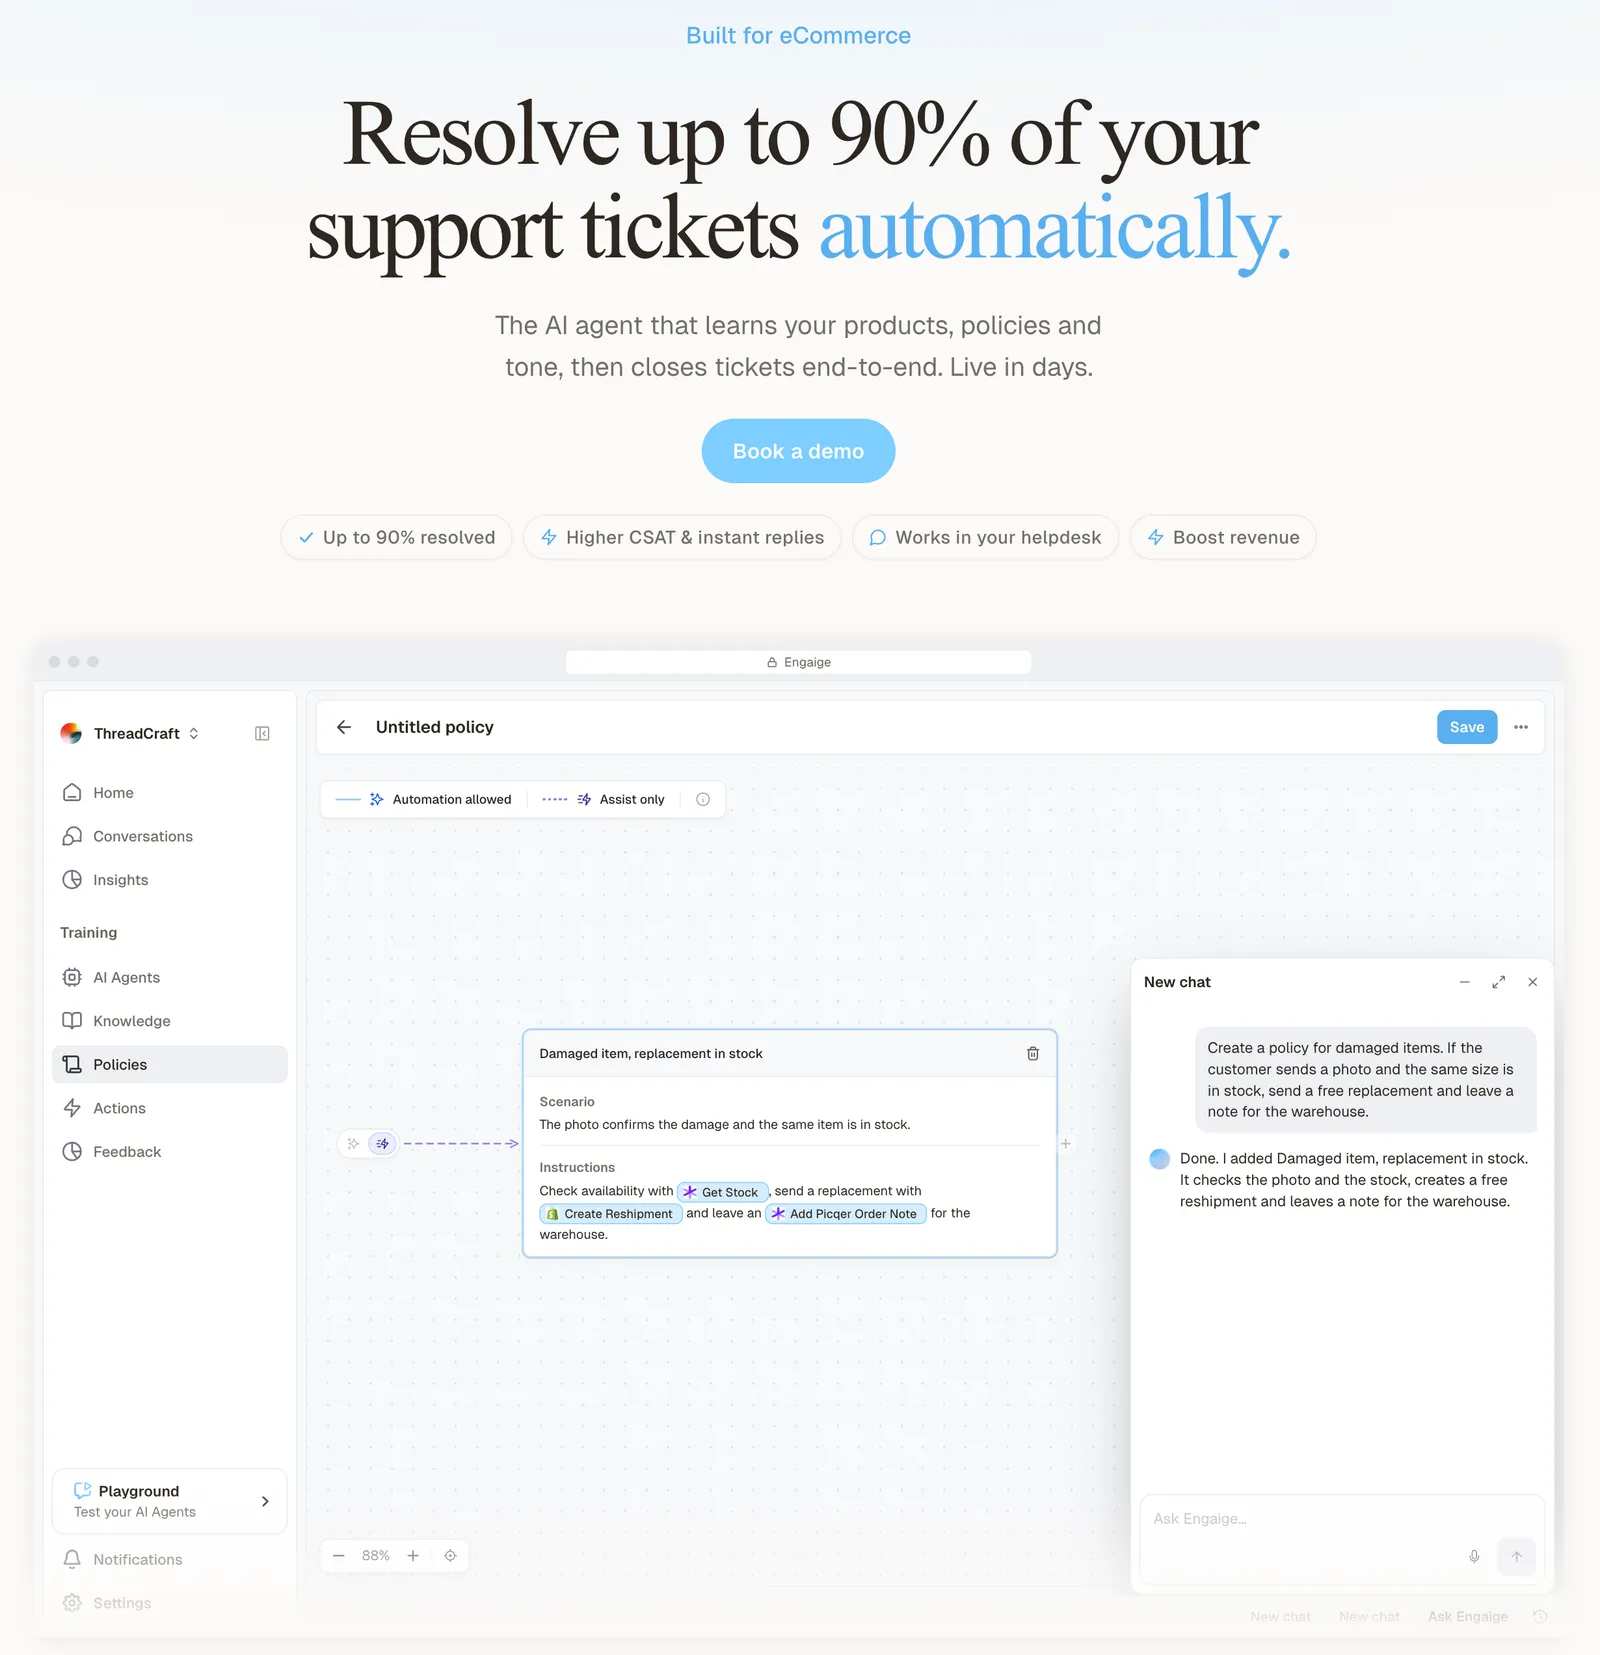
Engaige (that’s us) isn’t a ticket reporting tool: it is the e-commerce-native AI support agent that works inside your help desk, alongside your ticket reporting. Your help desk keeps producing the reports, and Engaige AI proposes policy changes, drawn from your team’s edits, for you to approve. Otrium has 60% of its 120,000 annual tickets resolved end to end with Engaige (Otrium case). Engaige AI shows which policies it used.
With Engaige, we are able to automatically resolve 60% of the 120,000 support tickets that we receive annually.

A ticket report shows which contact reasons grow, then leaves the reading and the fix to you. You go live in Agent Assist in hours, and every reply your team sends becomes training data. Engaige AI compares what your team said with what the agent suggested and proposes changes, which you approve. It keeps learning once autonomous: it surfaces emerging trends and the tickets where the agent hands back to your team, and proposes the policy change for you to approve, with its reasoning shown.

Hello Potential New Client
What would you like to get done today?
Could you analyse this week's conversations and show me some automation opportunities?
Ask Engaige…
Searched and found 4 contact reasons · 2.4s
Your agent resolved 426 of 512 conversations. 86 were handed over, and one contact reason accounts for most of them.
Searched and found 1 policy · 1.6s
Delivery status hands over whenever tracking is older than 24 hours, which is 40 of those 46.
Editing Delivery status · 1.9s
Done. It now handles stale tracking itself. Those 40 a week stay with your agent.
What were the reasons for handover, and how can we improve?
Fix it.
Reply…
Policies give detailed control over how the agent reasons, what process it follows and when it may act, and every answer and action shows why, with the source.
Scenario
The customer asks about a delivery address.
Instructions
Read the order with Get order , then take the branch that matches.
 Get order
 Scenario
The order has not been picked yet.
Instructions
Move it with Change picqer shipping address .
 Change picqer shipping address
 Scenario
The parcel has already left the warehouse.
Instructions
Say it cannot be redirected, then offer Process refund .
Keep your helpdesk. Replace the AI. The support hub has the full overview. To see it on your tickets, book demo.
Frequently asked questions
What is a ticket report?
A grouped view of tickets by period, channel, contact reason or agent that shows where a number comes from. It differs from a single metric, which is one number.
What should a weekly ticket report include?
Created against solved, the channel split, top contact reasons and their trend, reopens and backlog by age. Add one action under each chart.
What is the difference between ticket reporting and customer service metrics?
Metrics are the numbers. Ticket reports break them down so you can act. Use the standard definitions for first reply time, resolution time and CSAT, and keep them the same from report to report.
How do you track why customers contact you?
Use a short, fixed contact-reason dropdown filled on every ticket, and review it monthly, rather than free tags.
Should a ticket report use the average or the median?
The median for durations. One long ticket distorts the average.
Do AI-handled tickets show up in ticket reports?
Not always by default. Zendesk, for example, excludes AI-agent-only tickets from Explore reports except the Resolution type field. Put AI and human tickets in one view.
Does Engaige replace my help desk’s reporting?
No. Your help desk keeps reporting, and Engaige plugs into it. Once autonomous, Engaige AI also surfaces emerging trends and hand-backs, and proposes the policy change for you to approve.
Do I have to change my help desk to use Engaige?
No. Engaige plugs into the help desk you already run. Keep your helpdesk. Replace the AI.